Note
Click here to download the full example code
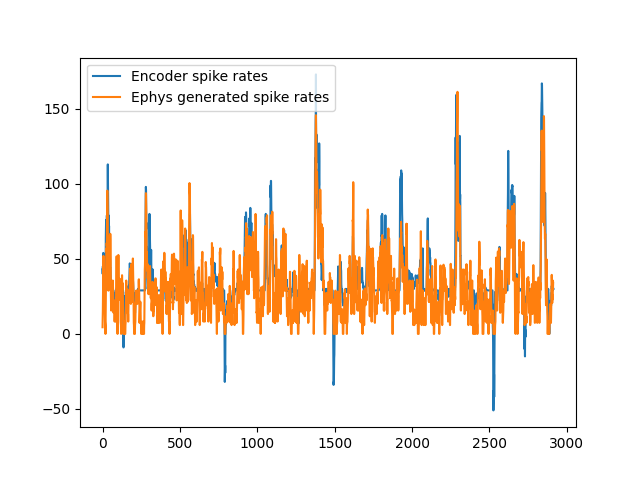
Visualize predicted spike rates with generated spikes
The goal of this example is to compare the spike rates predicted by the encoder with the spikes created by ephys generator.
To avoid downloading a big numpy file containing the electrophysiology data, we extracted the spike rates and stored it in a new file. Feel free to run the example locally, collecting your electrophysiology data and extracting the spike rates from it.
By default, this script downloads the data to be plotted from AWS S3, if you prefer to run this script with your own data, you can start the closed loop simulation in one terminal:
make run-closed-loop
And then record the stream in another terminal:
recorder --session "encoded_rates" --lsl "NDS-RawData,NDS-SpikeRates" --recording-time 10
Make sure to change the variable:
LOCAL_DATA = True
and replace the variables with the paths to your data:
RAW_DATA_PATH = "the_path_to_your_recorded_raw_data.npz"
ENCODER_SPIKE_RATES_PATH = "the_path_to_your_recorded_spike_rates_data.npz"
Configuration
LOCAL_DATA = False
Find spikes and bin rates from electrophysiology data
from urllib.parse import urljoin

import matplotlib.pyplot as plt
import numpy as np
import pooch
from scipy import signal

from neural_data_simulator.core.filters import BandpassFilter
from neural_data_simulator.core.filters import GaussianFilter


def threshold_crossing(a: np.ndarray) -> np.ndarray:
    return np.nonzero((a[1:] <= -200) & (a[:-1] > -200))[0] + 1


def get_bin_rates(samples: np.ndarray, duration: float) -> np.ndarray:
    bin_rates: list = [[] for channel in range(samples.shape[1])]
    for sample_slice in range(0, samples.shape[0], 600):
        sliced_sample = samples[sample_slice : sample_slice + 600, :]
        for channel in range(raw_data.shape[1]):
            spike_indices = threshold_crossing(sliced_sample[:, channel])
            rate = len(spike_indices) / duration
            bin_rates[channel].append(rate)
    return np.array(bin_rates)
Extract spike rates from electrophysiology data
if LOCAL_DATA:
    RAW_DATA_PATH = "encoded_rates_NDS-RawData.npz"
    raw_data_file = np.load(RAW_DATA_PATH)
    raw_data = raw_data_file["data"]
    raw_data_timestamps = raw_data_file["timestamps"] - raw_data_file["timestamps"][0]

    n_channels = raw_data.shape[1]

    raw_data_filter = BandpassFilter(
        name="bp_filter",
        filter_order=1,
        critical_frequencies=(250, 2000),
        sample_rate=30_000,
        num_channels=n_channels,
        enabled=True,
    )
    rates_filter = GaussianFilter(
        name="gauss_filter",
        window_size=6,
        std=3,
        normalization_coeff=6,
        num_channels=n_channels,
        enabled=True,
    )

    filtered_data = raw_data_filter.execute(raw_data)
    bin_rates = get_bin_rates(filtered_data, duration=1 / 50)
    filtered_bin_rates = rates_filter.execute(bin_rates.T).T

    np.savez("bin_rates_NDS-RawData.npz", filtered_bin_rates)
Set data source
Retrieve the data from AWS S3 or define local data paths
if LOCAL_DATA:
    GENERATED_BIN_RATES_PATH = "bin_rates_NDS-RawData.npz"
    ENCODER_SPIKE_RATES_PATH = "encoded_rates_NDS-SpikeRates.npz"
else:
    DOWNLOAD_BASE_URL = "https://neural-data-simulator.s3.amazonaws.com/sample_data/v1/"
    ENCODER_SPIKE_RATES_PATH = pooch.retrieve(
        url=urljoin(DOWNLOAD_BASE_URL, "encoded_rates_NDS-SpikeRates.npz"),
        known_hash="md5:79678d06ac67564c2d848d5d0c03c193",
    )
    GENERATED_BIN_RATES_PATH = pooch.retrieve(
        url=urljoin(DOWNLOAD_BASE_URL, "bin_rates_NDS-RawData.npz"),
        known_hash="md5:95deeb69eee64a75d86ba8bf3c2d3897",
    )
Load data
Load the data to be plotted.
encoder_spike_rates_file = np.load(ENCODER_SPIKE_RATES_PATH)
encoder_spike_rates_data = encoder_spike_rates_file["data"]

ephys_bin_rates = np.load(GENERATED_BIN_RATES_PATH)["arr_0"]
Align rates
def get_lag(x: np.ndarray, y: np.ndarray):
    correlation = signal.correlate(x, y, mode="full")
    lags = signal.correlation_lags(x.size, y.size, mode="full")
    lag = lags[np.argmax(correlation)]
    return abs(lag)


h_lag = get_lag(encoder_spike_rates_data.T[0], ephys_bin_rates[0])
aligned_encoder_spike_rates_data = encoder_spike_rates_data[h_lag:, :]
Plot rates
channel = 110

plt.plot(aligned_encoder_spike_rates_data.T[channel], label="Encoder spike rates")
plt.plot(ephys_bin_rates[channel], label="Ephys generated spike rates")
plt.legend()
plt.show()
Total running time of the script: ( 0 minutes 0.562 seconds)