Note
Click here to download the full example code
Visualize inter-spike interval (ISI)
The goal of this example is to calculate and plot the inter-spike interval (ISI) for a given channel of the raw data.
By default, this script will download the data to be plotted from AWS S3. If you prefer to use your own data, you can start the closed loop simulation in one terminal:
make run-closed-loop
And then record the stream in another terminal:
recorder --session "test" --lsl "NDS-RawData" --recording-time 10
Make sure to change the variable:
LOCAL_DATA = True
and replace the variable with the path to your data:
RAW_DATA_PATH = "the_path_to_your_recorded_raw_data.npz"
Environment setup
LOCAL_DATA = False
Set data source
Retrieve the data from AWS S3 or define the path to your local file.
from urllib.parse import urljoin

import pooch

DOWNLOAD_BASE_URL = "https://neural-data-simulator.s3.amazonaws.com/sample_data/v1/"

if not LOCAL_DATA:
    RAW_DATA_PATH = pooch.retrieve(
        url=urljoin(DOWNLOAD_BASE_URL, "example_NDS-RawData.npz"),
        known_hash="md5:887d88387674d8a7d27726e11663eee4",
    )
else:
    RAW_DATA_PATH = "the_path_to_your_recorded_raw_data.npz"
Load data
Load the data to be plotted.
from matplotlib.pyplot import figure
import matplotlib.pyplot as plt
import numpy as np

raw_data_file = np.load(RAW_DATA_PATH)
raw_data = raw_data_file["data"] / 4
raw_data_timestamps = raw_data_file["timestamps"] - raw_data_file["timestamps"][0]


CHANNEL = 20
THRESHOLD = -200
DURATION = raw_data_timestamps[-1] - raw_data_timestamps[0]
Calculating ISI
def threshold_crossing(a: np.ndarray, threshold: float) -> np.ndarray:
    """Computes the indices of the array where the values pass a threshold

    Args:
        a (ndarray): An array of shape (time,).
        threshold (float): A threshold to compare against the array. If
            positive the crossings will be greater than the threshold,
            if negative the crossing will be less than the threshold.
            If 0, raise an error, this case is ambiguous

    Returns:
        (ndarray) The indices into the array that correspond to a crossing.
    """
    if threshold > 0:
        return np.nonzero((a[1:] >= threshold) & (a[:-1] < threshold))[0] + 1
    elif threshold < 0:
        return np.nonzero((a[1:] <= threshold) & (a[:-1] > threshold))[0] + 1
    else:
        raise ValueError("Threshold must be non-zero")


def isi(spike_timestamps: np.ndarray) -> np.ndarray:
    spike_timestamps_integers = (spike_timestamps * 10000).astype("int64")
    isi = np.diff(spike_timestamps_integers).astype("float32") / 10000
    return isi
Plot data
plt.rcParams.update({"font.size": 14})
figure(figsize=(14, 10), dpi=180)
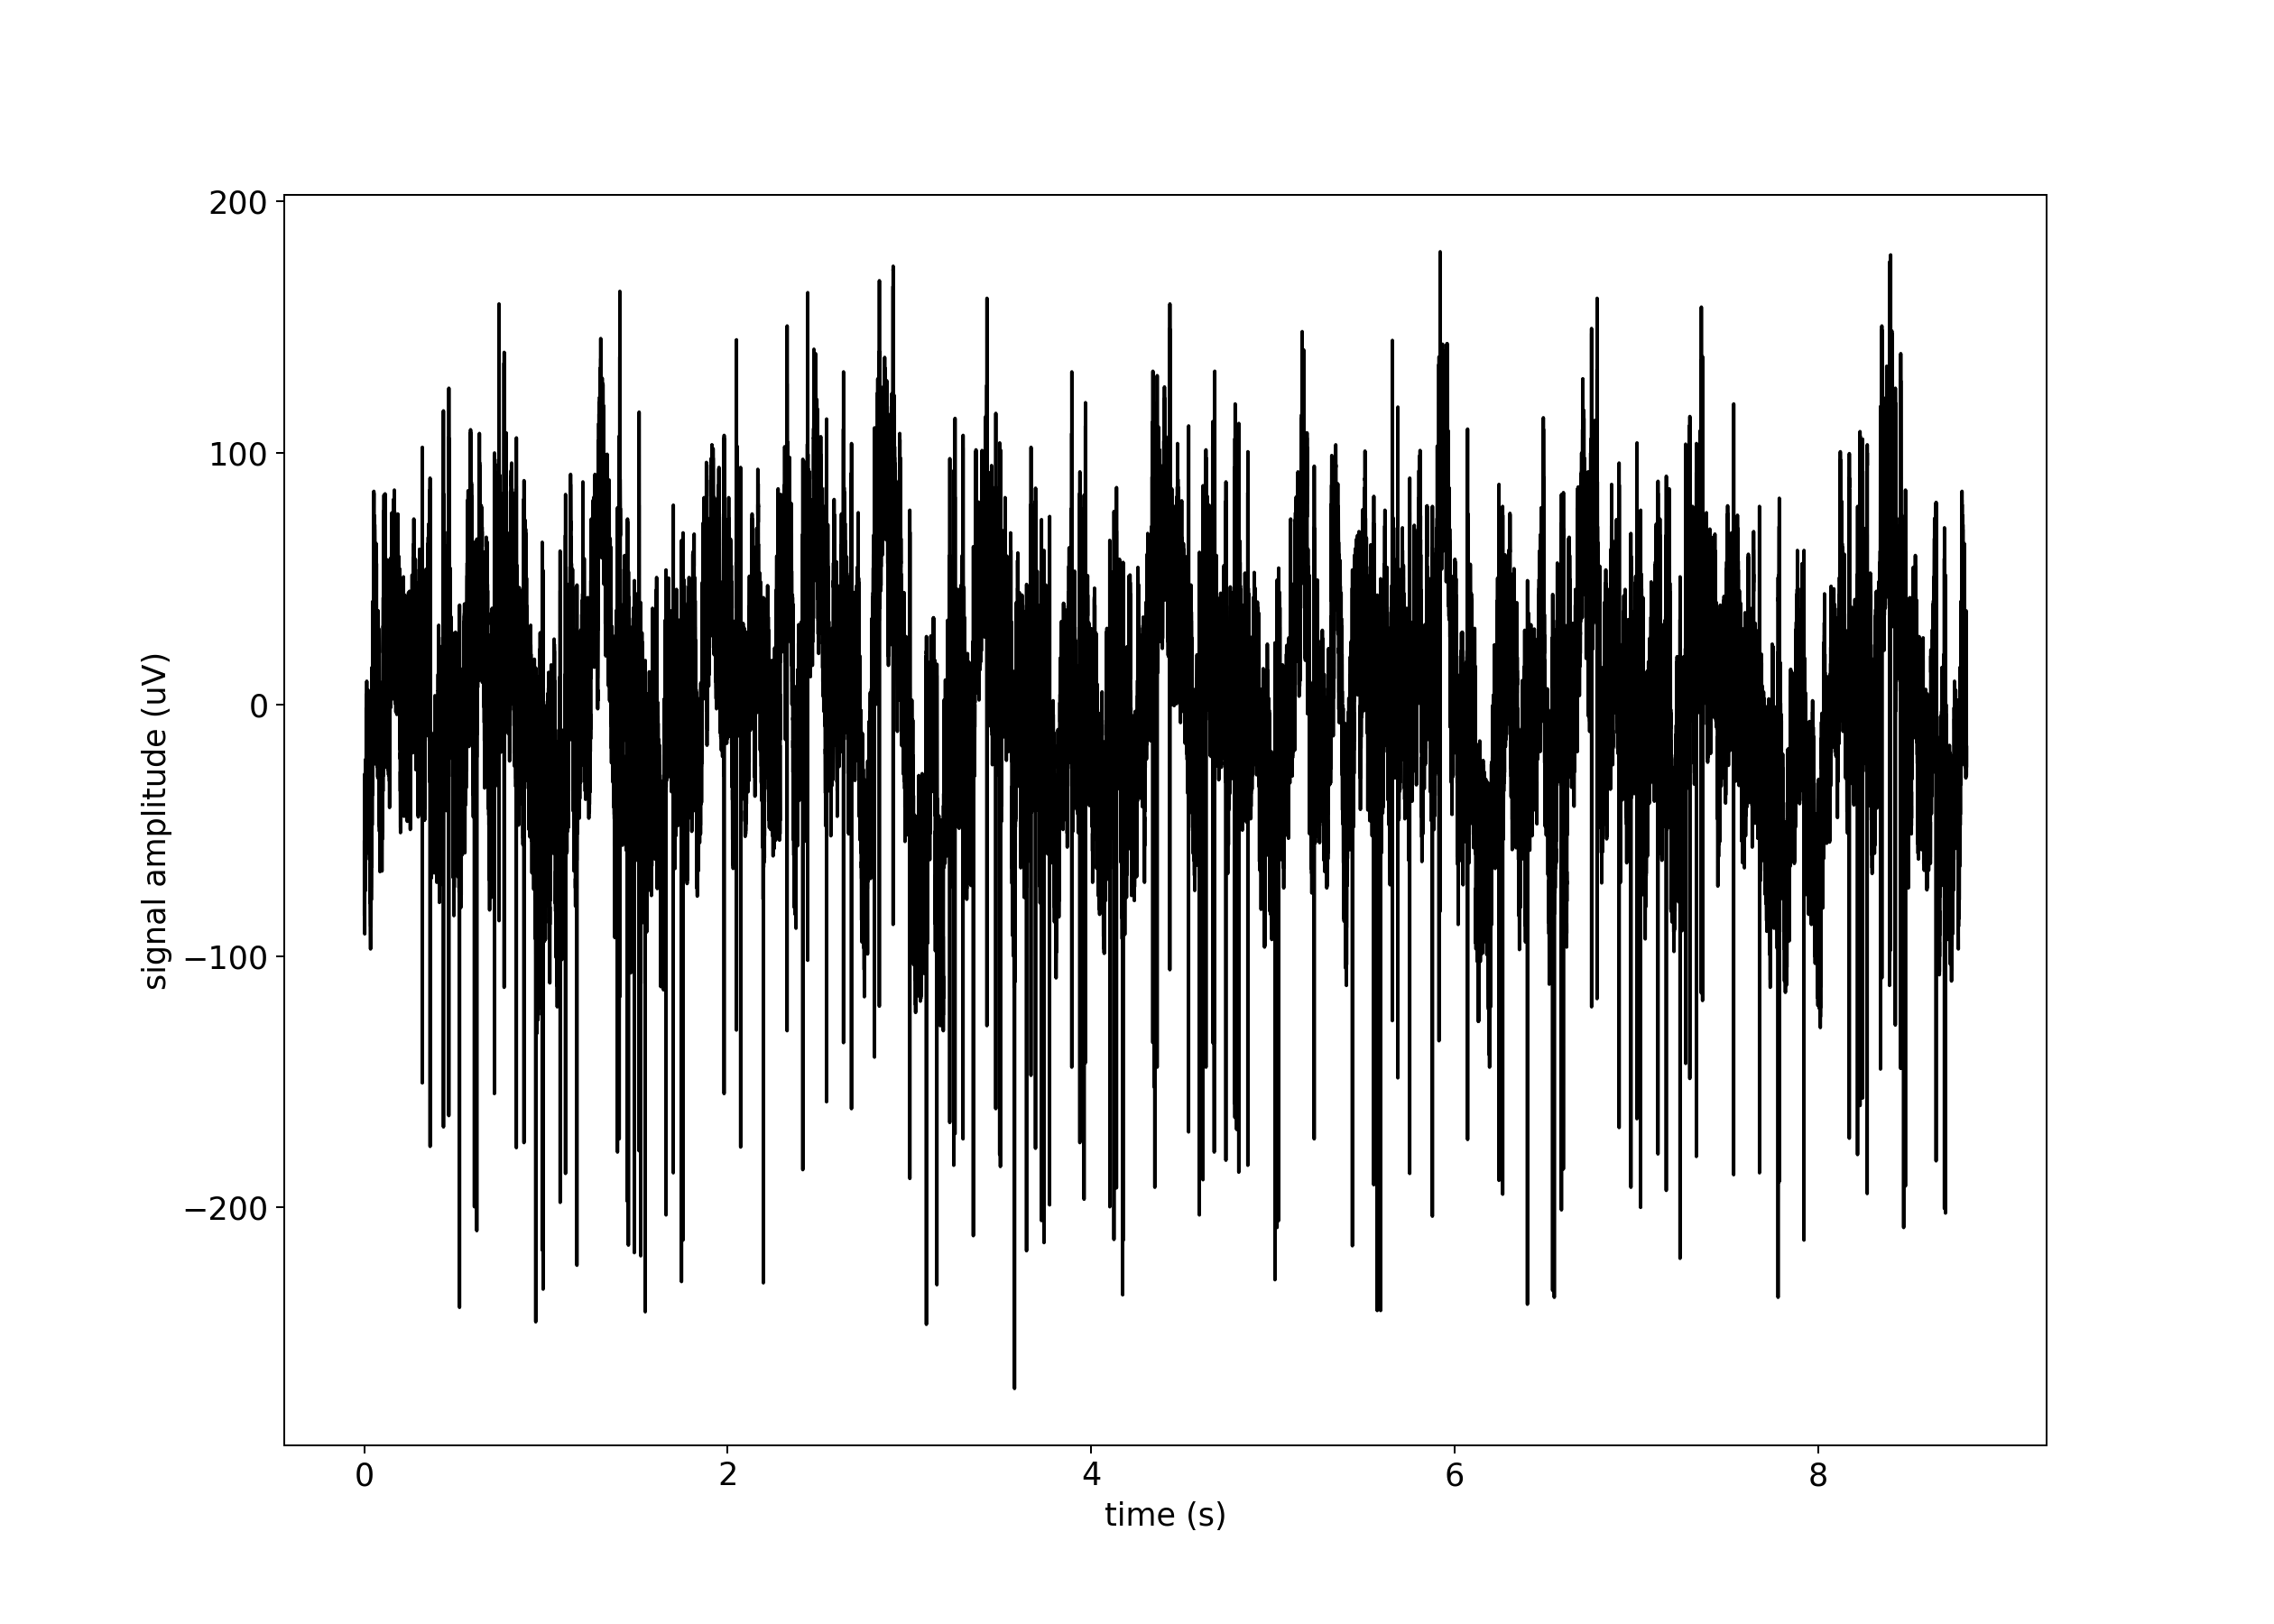
plt.plot(raw_data_timestamps, raw_data[:, CHANNEL], "k")
plt.ylabel("signal amplitude (uV)")
plt.xlabel("time (s)")
spike_indexes = threshold_crossing(raw_data[:, CHANNEL], THRESHOLD)
spike_timestamps = raw_data_timestamps[spike_indexes]
figure(figsize=(14, 10), dpi=180)
i = isi(spike_timestamps)
plt.hist(i, bins=100, range=[0, 1], label=f"CH{CHANNEL}: ISI")
plt.ylabel("spike count")
plt.xlabel("bin")
plt.legend()
mean_isi = np.mean(i)
var_isi = np.var(i)
spike_rate = len(spike_timestamps) / DURATION
print("calculated spikes: ", len(spike_indexes))
print("mean ISI: {}".format(mean_isi))
print("ISI variance: {}".format(var_isi))
print("spike rate: {}".format(spike_rate))
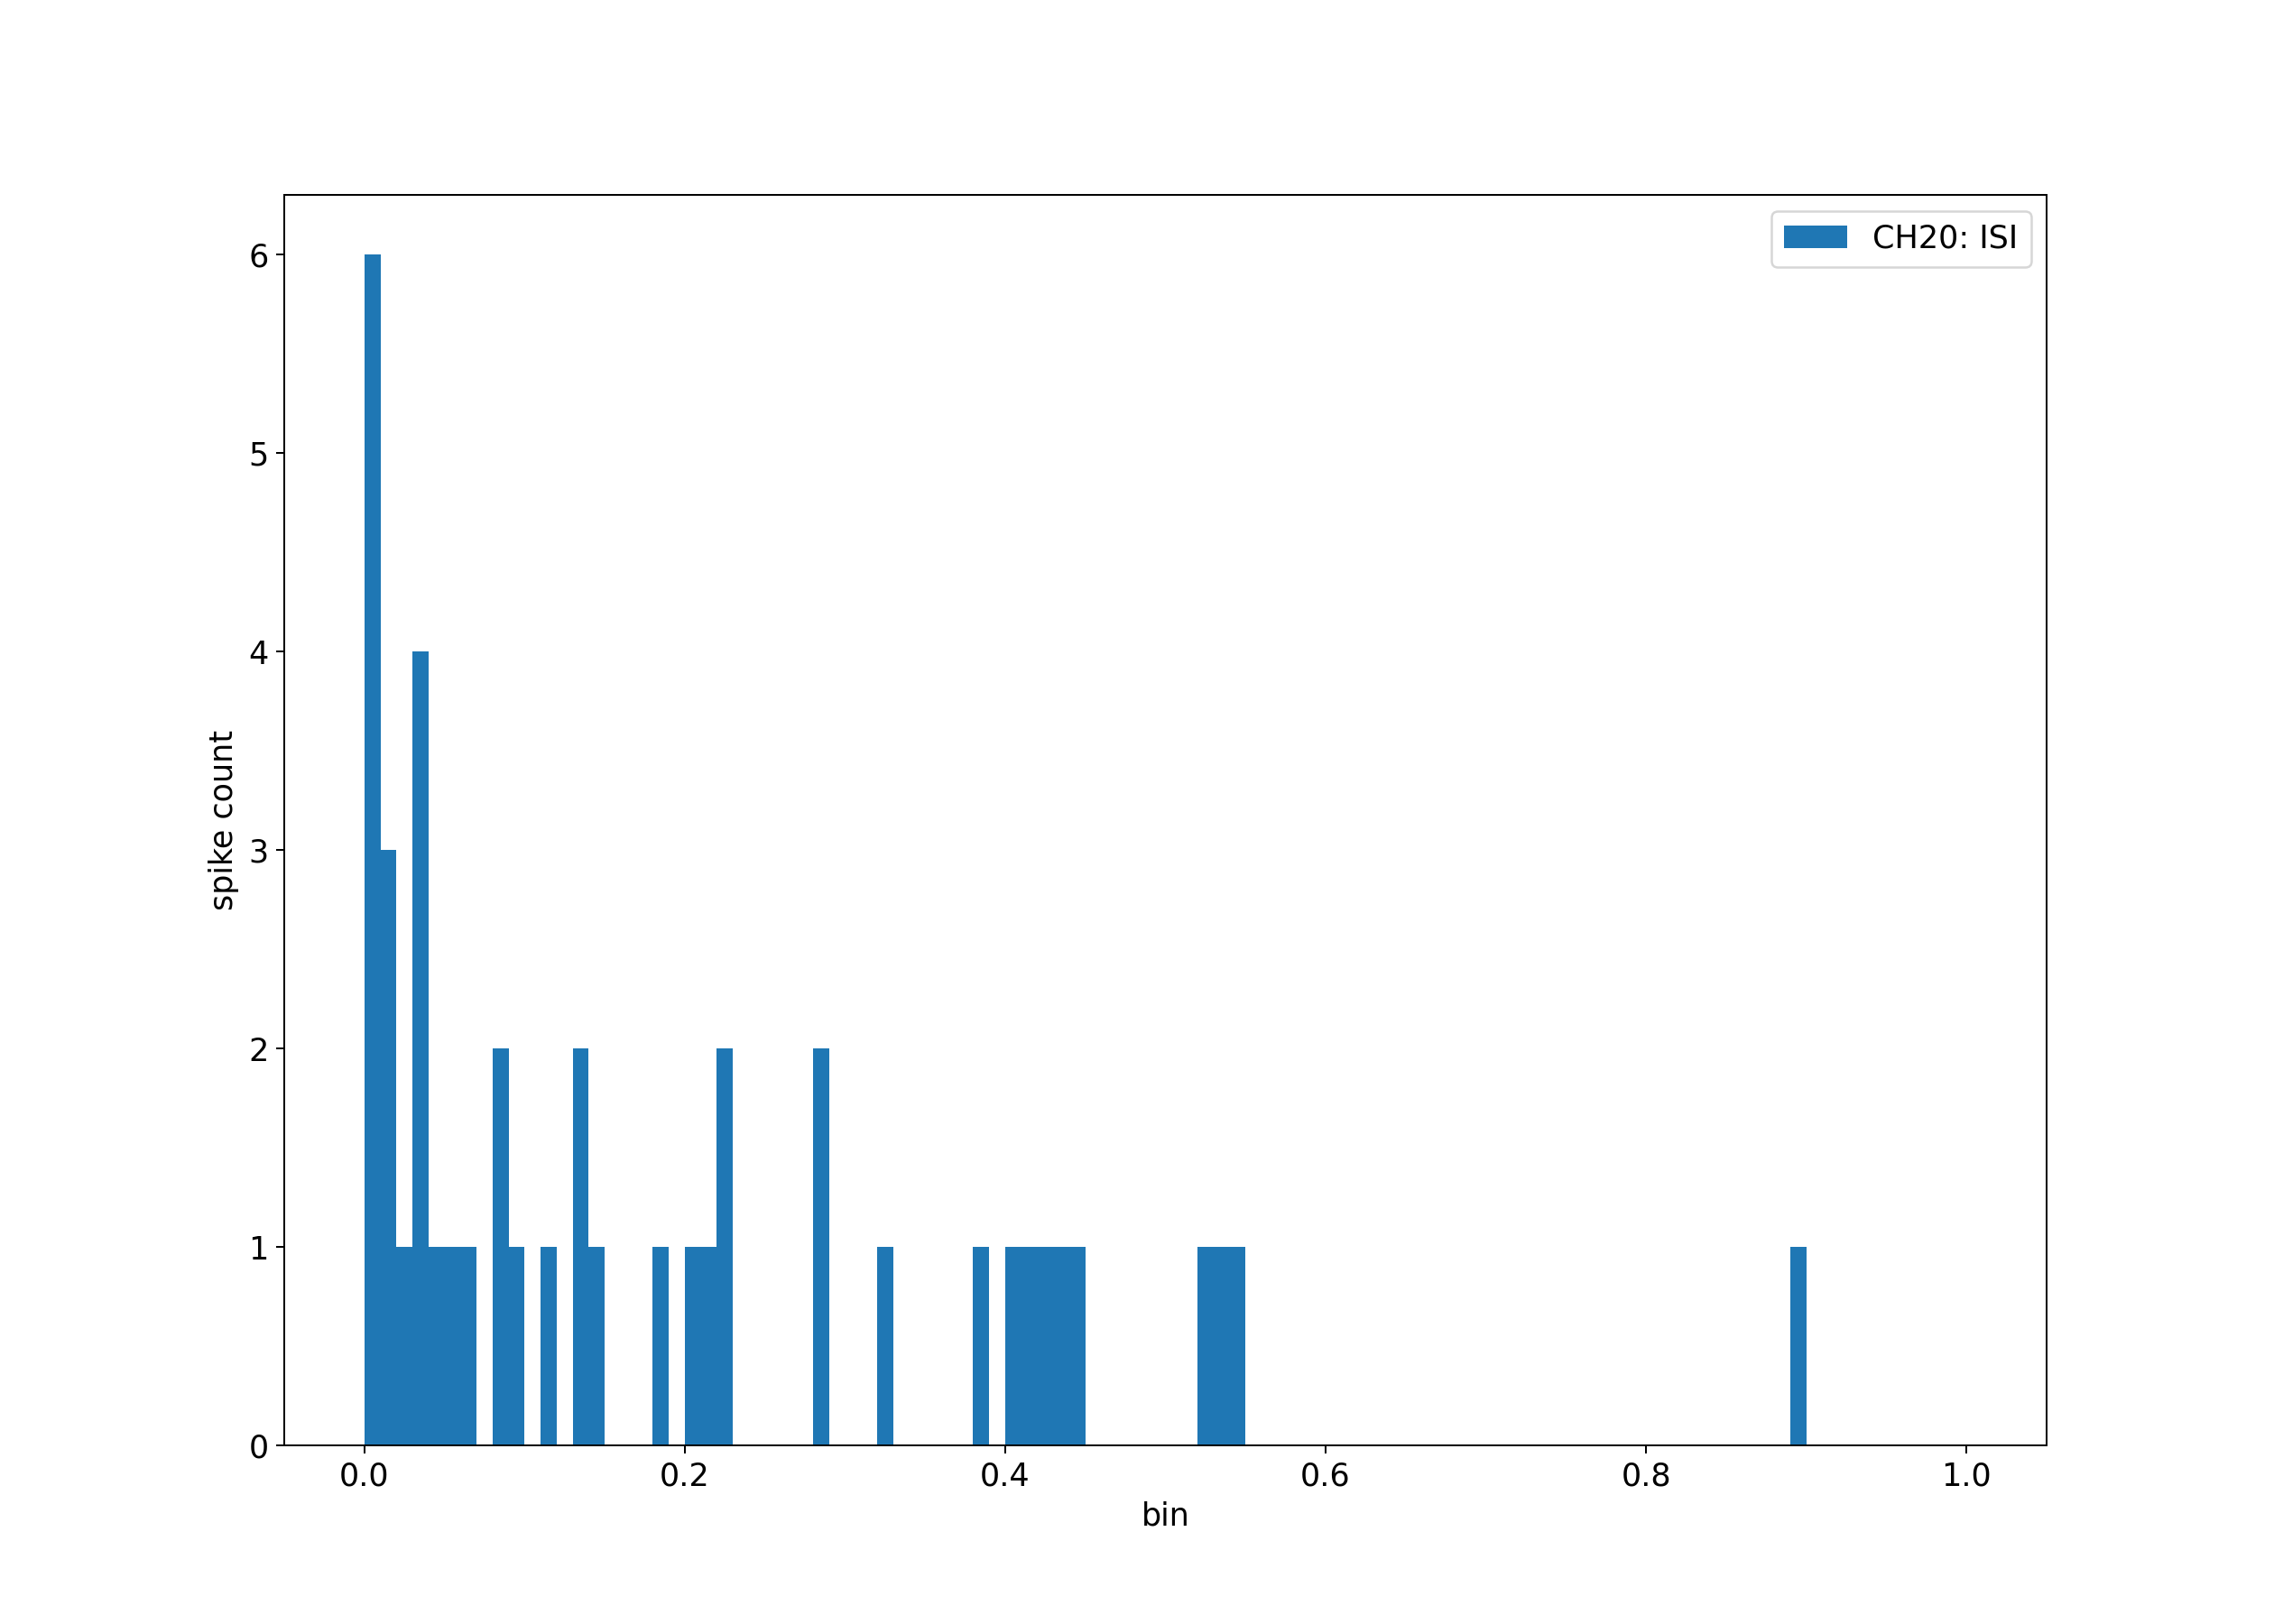
calculated spikes:  43
mean ISI: 0.19472619891166687
ISI variance: 0.04113312438130379
spike rate: 4.876569509340602
The values plotted and displayed above are reflecting the short sample we used for this example. For a longer recording, the values will be more similar to the ones used for training the model.
Total running time of the script: ( 0 minutes 1.781 seconds)